
You learn something new every single day.
For example, if you were to watch every single of episode of HBO’s Game of Thrones in succession, it would take you 30 hours. Also, French explorer Napoleon wasn’t actually a midget, and dogs sweat through their foot pads. It’s all pretty cool if you think about it.
So, what exactly do George Takei, Liam Neeson, and Henry Ford have in common? It’s simple – they’re all a part of some creative and interesting infographics making their way around the internet lately. Have you seen any lately that caught your eye?
Here are ten great infographics that you may have missed recently.
#1: How Long Will It Take To Watch…
(Neilson.com)

At some point or another, we’ve all binge-watched television shows and basically wasted a day or five of our lives in the process. Thanks, Netflix. This infographic from Neilson tells you how long it would take to watch certain shows, if you were to watch them from start to finish. Included on the graphic are popular shows like The Walking Dead, Game of Thrones, and House of Cards.
According to the infographic, it would take an astounding 146 hours to watch every episode of 24. Also, it would apparently take 90 hours to watch LOST, but surely no one would put themselves through that, right? Retweet this if you can think of 90 things you would rather do than watch that in succession.
#2: Team Starstruck Saves the World: The Superheroes of Twitter
(CornerstoneOnDemand.com)
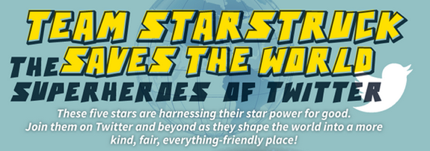
There aren’t many infographics out there that look more crisp than this one. This one takes a look at the Super Heroes of Twitter, and includes George Takei, Misha Collins, Ellen DeGeneres, Joss Whedon, and Taylor Swift, who all have various super powers in the Twitter realm. All five of them simply have a great presence on social media, with George Takei being a voice for LGBT rights, Ellen DeGeneres leading the cause for equality, and Taylor Swift for promoting children’s literacy.
While this infographic looks great and sends a great message, I noticed one omission. I reached out to find out why Hulk Hogan wasn’t included, but haven’t received a response yet. Slamming Andre the Giant at WrestleMania III is a part of American History. Take your vitamins and say your prayers, brother.
#3: How To Spice Up Your Hot Chocolate
(SheKnows.com)

It’s the Holiday Season, which means gift giving, cold weather, and spiked egg nog have arrived. Traditional hot chocolate doesn’t have to be boring though, and can be ‘spiced up,’ as this simple, but effective infographic suggests. One of the suggestions in this infographic even includes adding a cayenne pepper to your hot chocolate. Now that’s what I call “hot chocolate.” Get it? On a side note, the chocolate chips don’t really look like chocolate chips. They could use a redesign (you see it now), but other than that, it’s a great infographic to hang onto this year.
#4: Alcohol & Weight Gain: How Alcohol Contributes To Weight Gain
(LucasJamesPersonalTraining.com)

Some things just can’t be disputed. Emmanuel Lewis and Gary Coleman were actually different people, you can’t drive to Hawaii, Peter Criss isn’t really a cat, and alcohol contributes to weight gain. This infographic has a lot of great information, and breaks down the process of alcohol intake and how it eventually leads to weight gain and/or a slowed metabolism.
According to this infographic, a glass of wine is just about equal in calories to a slice of cake. If that’s the case, I’ve consumed many bakeries, and they’ve been good. Honestly though, the average wine drinker consumes 2,000 extra calories per month, as this graphic states, which is roughly 141 ice cream cones per year. What kind of ice cream are we talking about?
#5: Where Did My Missing Sock Go?
(SockSync.com)
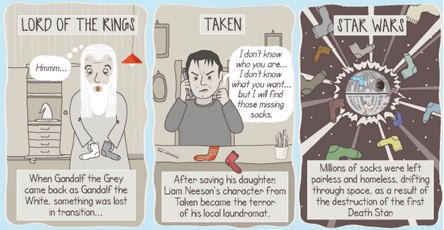
Do you ever get really angry when you lose something? While most get irrationally mad about losing their phones, I stand with Liam Neeson, Bowser, and Walter White, and get furious when I lose my socks. Blood boiling anger like never before. This infographic from SockSync parodies various television series and films, where some of your favorite characters lose their socks.
Honestly, this infographic does make a good point. When the Titanic went down, Jack probably would have survived in the freezing water if he had socks on. That’s careless and bad planning on his part, so it’s difficult to feel bad for him. If anything, learn from the mistakes of others, and keep your friends close, and your socks closer.
#6: Best in Show: The Ultimate Data-Dog
(Slate.com)
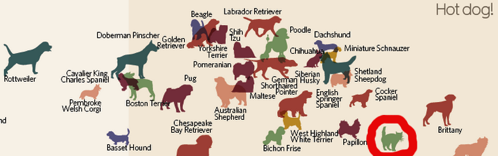
First of all, let’s get something out of the way. There is a cat on this infographic, and it’s rude to show up to a party that you’re not invited to. Who does he think he is? Anyway, this neat infographic takes a look at dogs of all kinds, from those that are very popular among the public, to those that would be considered ‘overlooked treasures.’
There are a few dozen types of dogs here, and while the infographic might not be the most visually appealing out there because of the congestion, it’s interesting to look through. Contrary to popular belief, Pharaoh Hounds don’t come from Egypt. Mind-blowing, if we’re being real.
#7: The Tradesmen That Built America
(WeldingSchool.com)
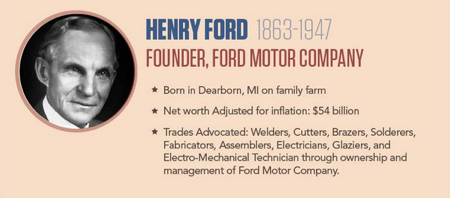
The United States celebrated its 238th Birthday this year, so it’s only fitting that this infographic celebrates the Tradesmen that built America. Some of the individuals included here include Henry Ford, Thomas Edison, and John D. Rockefeller; people that you may have heard of before.
Everyone included here has helped shape the United States into what it is today. Willis Carrier is featured here too – the man who patented air conditioning in 1902. It’s impossible to tell if anyone would even be living in Arizona if he didn’t. It gets hot there, in case you missed it.
#8: Common MythConceptions – World’s Most Contagious Falsehoods
(InformationIsBeautiful.net)
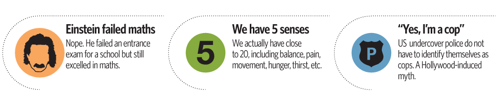
This infographic has a pretty creative title, called ‘Common MythConceptions.’ Get it? It’s because ‘myths’ and ‘misconceptions’ are basically the same thing, so they just combined the two words. Creativity through the roof. It doesn’t get much more impressive than that.
For example, one mythconception shown on this infographic is that a dropped penny from the top of the Empire State Building can’t actually kill you, which is good to know. Also, according to this infographic, while not the smartest, goldfish actually boast a memory span of three months – better than most politicians.” It’s better than all Indianapolis Colts fans, too.
#9: Ladies Love Football
(DicksSportingGoods.com)
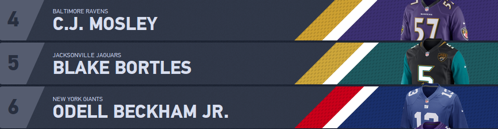
Football is awesome, just Google it. Every Sunday in the fall, you can throw your jersey on, down a beer or ten, and either get excited or become extremely frustrated. This infographic takes a look at the most popular jerseys in the United States among women, with each state crowning a player, based on the most jerseys sold throughout 2014. Clearly, the bandwagon fans around the country have latched onto Seahawks Quarterback Russell Wilson.
In New York, the most popular jersey among women has been for Buffalo Receiver Sammy Watkins. It’s a jersey the ladies won’t have to get dirty in January though, because the last time Buffalo made the playoffs, Bill Clinton was still the President, people were scared of the Y2K bug, and the kid from The Sixth Sense was seeing dead people.
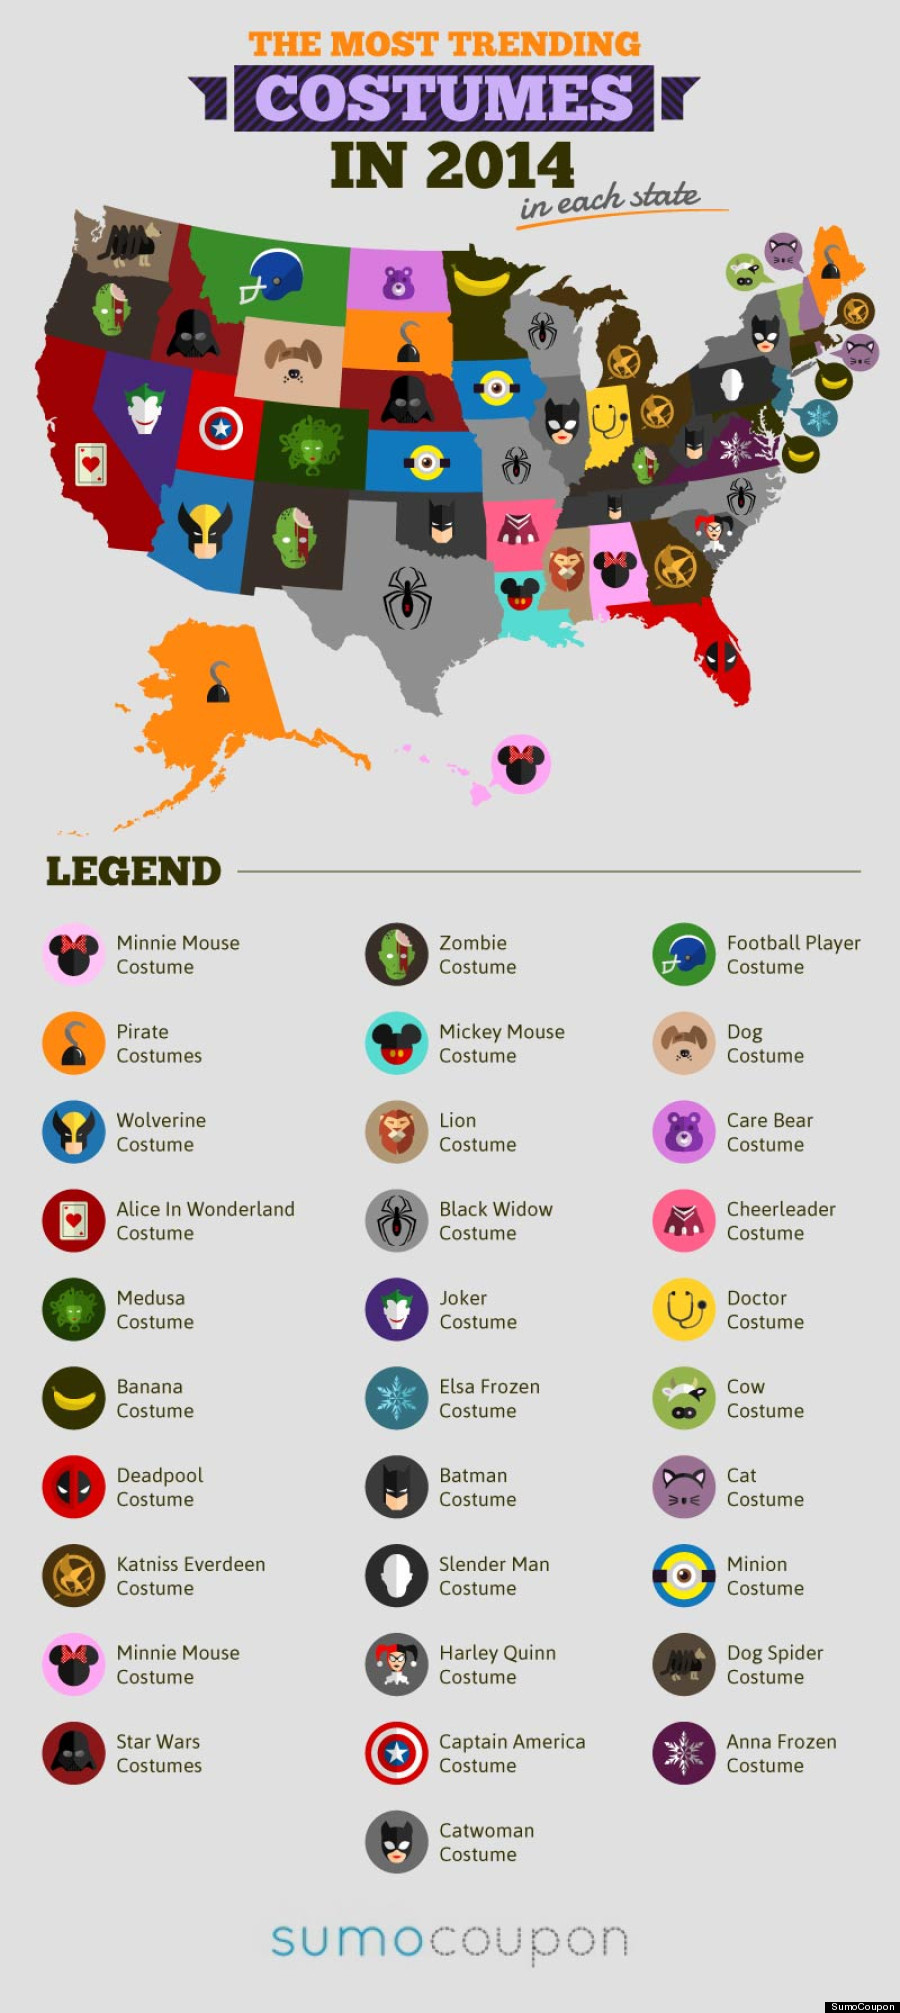
#10: The Most Trending Costumes In 2014: In Each State
(SumoCoupon.com)
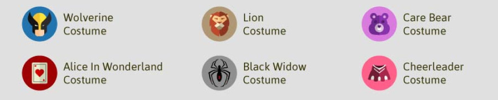
You’re probably thinking, “Why is this on here? Halloween has already passed.” It has, but it wasn’t the last Halloween that we’ll ever experience. This is another great infographic that takes a look at each of the 50 United States, and shows you what the most trending costumes were across the board this year. Just as everyone expected, Minnie Mouse has a huge fanbase in Hawaii and Alabama.
It also makes you wonder what a Dog Spider is, and why it’s such a phenomenon in the Pacific Northwest. Then again, the State of Washington did legalize marijuana, so that might explain it. Could Batman beat a Dog Spider in a no holds barred brawl? I couldn’t tell you that, because I’ve never actually seen the two go at it before.
If you have seen any great infographics lately, be sure to share them with us in the comments section.


27 Responses
@NinjasMarketing Digital Dojo: What Do George Takei, Liam Neeson, And Henry Ford Have In Common? http://t.co/P81fk8aXK5
New @webuildpages: Digital Dojo: What Do George Takei, Liam Neeson, And Henry Ford Have In Common? http://t.co/AieOOklZnz
Digital Dojo: What Do George Takei, Liam Neeson, And Henry Ford Have In Common? http://t.co/LVL04waw3m #OnlineMarketing
Digital Dojo: What Do George Takei, Liam Neeson, And Henry Ford Have In Common? | http://t.co/2cDqqiWBSi via @mjtiscione @NinjasMarketing
RT @mjtiscione: Digital Dojo: What Do George Takei, Liam Neeson, And Henry Ford Have In Common? | http://t.co/2cDqqiWBSi via @mjtiscione @N…
RT @NinjasMarketing: Digital Dojo: What Do George Takei & Liam Neeson Have In Common? http://t.co/vELYXz7izg by @mjtiscione
RT @NinjasMarketing: Digital Dojo: What Do George Takei & Liam Neeson Have In Common? http://t.co/vELYXz7izg by @mjtiscione
RT @NinjasMarketing: Digital Dojo: What Do George Takei & Liam Neeson Have In Common? http://t.co/vELYXz7izg by @mjtiscione
RT @NinjasMarketing: Digital Dojo: What Do George Takei & Liam Neeson Have In Common? http://t.co/vELYXz7izg by @mjtiscione
Digital Dojo: What Do George Takei, Liam Neeson, And Henry Ford Have In Common? http://t.co/KslXUpFD6L #seo
Digital Dojo: What Do George Takei, Liam Neeson, And Henry Ford Have In Common? http://t.co/gL4NhgkUPu
Digital Dojo: What Do George Takei, Liam Neeson, And Henry Ford Have In Common? | http://t.co/tyt3itb2lU via @mjtiscione @NinjasMarketing
Digital Dojo: What Do George Takei, Liam Neeson, And Henry Ford Have In Common? @zee_skdr http://t.co/20TeYzIJmc
Digital Dojo: What Do George Takei, Liam Neeson, And Henry Ford Have In Common? | http://t.co/URHRXpA5kf via @mjtiscione @NinjasMarketing
Digital Dojo: What Do George Takei, Liam Neeson, And Henry Ford Have In Common? | http://t.co/R8n0dx4OK9 via @mjtiscione @NinjasMarketing
RT @IMNinjaMike: Digital Dojo: What Do George Takei, Liam Neeson, And Henry Ford Have In Common? | http://t.co/R8n0dx4OK9 via @mjtiscione @…
RT @IMNinjaMike: Digital Dojo: What Do George Takei, Liam Neeson, And Henry Ford Have In Common? | http://t.co/R8n0dx4OK9 via @mjtiscione @…
RT @IMNinjaMike: Digital Dojo: What Do George Takei, Liam Neeson, And Henry Ford Have In Common? | http://t.co/R8n0dx4OK9 via @mjtiscione @…
RT @IMNinjaMike: Digital Dojo: What Do George Takei, Liam Neeson, And Henry Ford Have In Common? | http://t.co/R8n0dx4OK9 via @mjtiscione @…
Digital Dojo: What Do George Takei, Liam Neeson, And Henry Ford Have In Common? | http://t.co/d7Hkueqyv9 via @mjtiscione @NinjasMarketing
Digital Dojo: What Do George Takei, Liam Neeson, And Henry Ford Have In Common? | http://t.co/R8n0dx4OK9 via @mjtiscione @NinjasMarketing
Digital Dojo: What Do George Takei, Liam Neeson, And Henry Ford Have In Common? | http://t.co/s6bz7COYNR via @mjtiscione @NinjasMarketing
Digital Dojo: What Do George Takei, Liam Neeson, And Henry Ford Have In Common? http://t.co/TAhCWG7I2j RT @mjtiscione
Digital Dojo: What Do George Takei, Liam Neeson, And Henry Ford Have In Common? http://t.co/p5XBvznQIX RT @mjtiscione
RT @seosmarty: Digital Dojo: What Do George Takei, Liam Neeson, And Henry Ford Have In Common? http://t.co/p5XBvznQIX RT @mjtiscione
RT @seosmarty: Digital Dojo: What Do George Takei, Liam Neeson, And Henry Ford Have In Common? http://t.co/p5XBvznQIX RT @mjtiscione
Rooted Marketing LLC liked this on Facebook.
Comments are closed.