
Infographics are a perfect way to learn about new things, while also being exposed to creative and fun designs. The best infographics aren’t always the ones that simply look the most visually appealing either. They need to have information in them that readers will find value in, while also being nice to look at. Solid information and unique design together create the perfect infographic.
What’s the coolest infographic that you’ve seen lately? Here are some of the best that have been making their way around the internet lately.
#1: The Ultimate Guide To Office Bathroom Etiquette (DesignTaxi.com)
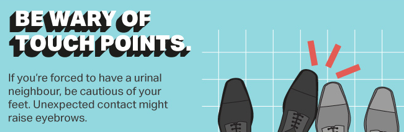
If you ever have to go at work, be considerate to others. Whether you’re there to do a #1, #2, or #3 (that last one is probably best suited for another time), there are strict rules to follow. This infographic covers everything, and even reminds you to back off if someone is in the stall crying.
Honestly, it might be because they’ve been in there awhile, so you wouldn’t want to get close anyway. Also, as the infographic suggests, wash your hands when you’re finished. It’s rude if you don’t.
#2: 50 Fictional Locations You Can Actually Visit (JustTheFlight.co.uk)

Did you know that fictional places are actually filmed in real places? Mind-blowing. This infographic looks at 50 places around the world that you can go see for yourself, all places that have been seen in books, movies, games, and more. For example, did you know that Jurassic Park isn’t actually a real place?
The island of Kaua’i in Hawaii was chosen by Steven Spielberg as the main location for the film. Also, surprisingly enough, Veronia Mars never really stepped foot on Neptune; the show was actually filmed in Santa Ana, California.
#3: The World’s Biggest Land, Sea and Air Vehicles (Visualistan.com)
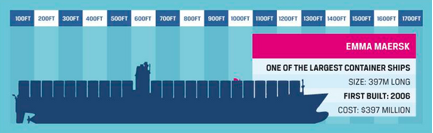
Once upon a time, people could only get around on foot. Can you imagine that? Unbelievable, really. This infographic, titled The World’s Biggest Land, Sea and Air Vehicles looks at some of the largest forms of transportation out there, dating as far back as 1942.
This infographic also features the Knock Nevis Supertanker, a ship that not only sounds like something that would go to war with the Power Rangers, but cost $780 Million in 2003, which is the same as 483,427,128 pounds for our friends in England. Perhaps the most impressive part of this infographic is that there are 28 vehicles featured, all including interesting, in-depth information that is worth checking out.
#4: Every Person Liam Neeson Has Killed (And How), Mapped Out (SomeECards.com)
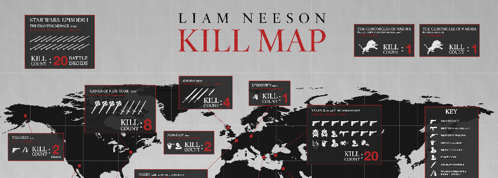
You might know Liam Neeson from the Taken films, where his daughter gets kidnapped and he eventually saves her, and then he and his ex-wife get kidnapped, and he instructs his daughter on how to save him and his ex-wife. Trust me, it’s wild if you haven’t seen it.
To make this all possible, however, lives have to end, and this infographic shows how many people Neeson has killed in the various films he has appeared in, including how he disposed of them. According to the infographic, Neeson has ended 115 lives. He was pretty tame in the Chronicles of Narnia though, only ending one person’s dreams.
#5: Wine Map of Southern Europe (Venere.com)
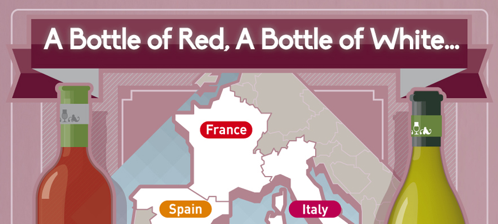
Wine has been around for nearly 10,000 years, which is about as long as the Buffalo Bills playoff drought. This infographic, which is a Wine Map of Southern Europe, covers Spain, France, and Italy, and is perfect if you’re a wine aficionado.
For each country, the infographic displays where each wine comes from, the names of the grapes used, as well as various characteristics of the wine. For example, Godello is a wine that comes from Spain, and it’s apparently spicy and crisp, just like this infographic.
#6: Supercharge Your Teamwork (InLoox.com)
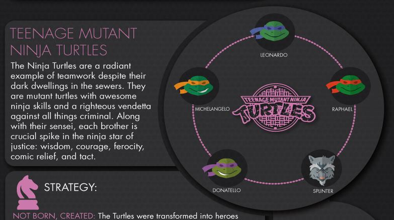
What does ‘Teamwork’ mean to you? This infographic looks at some of the greatest and most famous teams in our history, like the Teenage Mutant Ninja Turtles, who are probably the best team in the history of ever. Not only is this infographic incredible to look at, but it gives insight into what each team was about, the strategy they carried out to be a great team, as well as more fun and useful information.
Aside from the Ninja Turtles, other teams featured include the Guardians of the Galaxy, the Mighty Ducks, and the Fellowship of the Ring. Gimli’s beard game is just as strong on this infographic as it is in The Lord of the Rings too. We wouldn’t expect anything less from a great infographic, and you shouldn’t either.
#7: 11 Untranslatable Words From Other Cultures (Maptia.com)
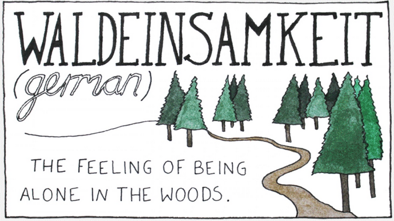
Have you ever felt Waldeinsamkeit before? It’s awkard – I’ve been there. When you see this infographic, you’ll definitely learn quite a bit from it, and will be able to take away words that you can use in conversation with your friends to make it appear like you’re smarter than them.
The next time you’re standing out at sea, imagine saying the words, “The Mångata. It’s beautiful tonight.” When your friends look at you like you have seven heads, you can explain to them that “Mångata” is Swedish for “the roadlike reflection of the moon on the water.” Sophistication for days. Shakespeare would be proud.
#8: A Deep Dive Into Today’s Advertising Landscape (Mashable.com)

Advertising has changed drastically over the years, and this informative and creative infographic takes a look at the new advertising landscape. Did you know that total Mobile Ad Spending is up to $31.45 Billion in 2014? Did you also know that Total Media Ad Spending recently reached a record-high of $171 Billion? You do now, and that’s important.
#9: Flip That Funky House (DecorativeCeilingTiles.net)

In 1819, Rip Van Winkle was born, and in 1967, Robert Matthew Van Winkle was born. The latter would eventually grow up to become Vanilla Ice, the guy with the hit song “Ice Ice Baby” which captured the hearts of teenagers and single moms in 1989.
After releasing only one hit song in his career, Vanilla Ice somehow got involved with house-flipping, and would eventually land a show on the DIY Network known as The Vanilla Ice Project, clearly the inspiration for this infographic. This neat graphic basically chronicles Vanilla Van Winkle’s career, with information on his show, DIY projects, and even gives you insight into the time he went Amish.
Have you seen any infographics lately that you’ve been particularly impressed by? Share them with us in the comments section.


42 Responses
‘9 Infographics That You Can’t Miss Right Now’ by @NinjasMarketing http://t.co/7pBfjdo2Ev
@NinjasMarketing Digital Dojo: 9 Infographics Worth Checking Out http://t.co/mJoUAYhTfA
New @webuildpages: Digital Dojo: 9 Infographics Worth Checking Out http://t.co/QvqQXKzcvQ
Digital Dojo: 9 Infographics Worth Checking Out: Infographics are a perfect way to learn about new things, whi… http://t.co/04VDfdC1Y2
New @NinjasMarketing Digital Dojo: 9 Infographics Worth Checking Out http://t.co/b9A8jMlfe4 #smm
RT @NinjasMarketing: Digital Dojo: 9 #Infographics Worth Checking Out by @IMNinjaMike http://t.co/UTPseeFxqi
Digital Dojo: 9 Infographics Worth Checking Out | http://t.co/Sym6FxtMy0 @mjtiscione @NinjasMarketing
Digital Dojo: 9 Infographics Worth Checking Out http://t.co/VsO1PrhnA9 #OnlineMarketing
RT @NinjasMarketing: Digital Dojo: 9 #Infographics Worth Checking Out by @IMNinjaMike http://t.co/UTPseeFxqi
‘Digital Dojo: 9 Infographics Worth Checking Out’ by @mjtiscione @NinjasMarketing http://t.co/XkuewU8uoW
Digital Dojo: 9 Infographics Worth Checking Out http://t.co/HnBZjO6RId #seo
@Maptia Hey there. I mentioned your Infographic in this post, check it out: http://t.co/E98e4cvBln
RT @NinjasMarketing: Digital Dojo: 9 #Infographics Worth Checking Out by @IMNinjaMike http://t.co/UTPseeFxqi
Digital Dojo: 9 Infographics Worth Checking Out | http://t.co/j2AIPpPnsq via @mjtiscione @NinjasMarketing
Digital Dojo: 9 Infographics Worth Checking Out | http://t.co/Sym6FxtMy0 via @mjtiscione @NinjasMarketing
Digital Dojo: 9 Infographics Worth Checking Out | http://t.co/iTbuvqvsXA via @mjtiscione @NinjasMarketing
RT @IMNinjaMike: Digital Dojo: 9 Infographics Worth Checking Out | http://t.co/iTbuvqvsXA via @mjtiscione @NinjasMarketing
‘Digital Dojo: 9 Infographics Worth Checking Out’ by @NinjasMarketing http://t.co/RQ5MwvKRrC
what do you think? Digital Dojo: 9 Infographics Worth Checking Out http://t.co/gA1TvbWbrE
Digital Dojo: 9 Infographics Worth Checking Out | http://t.co/Sym6FxtMy0 via @mjtiscione @NinjasMarketing
RT @mjtiscione: Digital Dojo: 9 Infographics Worth Checking Out | http://t.co/Sym6FxtMy0 via @mjtiscione @NinjasMarketing
Digital Dojo: 9 Infographics Worth Checking Out via @mjtiscione @NinjasMarketing http://t.co/t7mV33tsqF RT @mjtiscione
RT @IMNinjaMike: Digital Dojo: 9 Infographics Worth Checking Out | http://t.co/iTbuvqvsXA via @mjtiscione @NinjasMarketing
Digital Dojo: 9 Infographics Worth Checking Out via @mjtiscione @NinjasMarketing http://t.co/0m0bwKzB6j RT @mjtiscione
RT @seosmarty: Digital Dojo: 9 Infographics Worth Checking Out via @mjtiscione @NinjasMarketing http://t.co/0m0bwKzB6j RT @mjtiscione
RT @seosmarty: Digital Dojo: 9 Infographics Worth Checking Out via @mjtiscione @NinjasMarketing http://t.co/0m0bwKzB6j RT @mjtiscione
—> RT @seosmarty: Digital Dojo: 9 Infographics Worth Checking Out via @mjtiscione @NinjasMarketing http://t.co/mqAPjOwmnn RT @mjtiscione
—-> RT @Deekhumzy: Digital Dojo: 9 Infographics Worth Checking Out via @mjtiscione @NinjasMarketing http://t.co/mqAPjOwmnn RT @mjtiscione
Digital Dojo: 9 Infographics Worth Checking Out via @mjtiscione @NinjasMarketing http://t.co/yZvKbRjXLF RT @mjtiscione
—–> RT @SanaKnightly: Digital Dojo: 9 Infographics Worth Checking Out via @mjtiscione @NinjasMarketing http://t.co/mqAPjOwmnn
RT @mjtiscione: —–> RT @SanaKnightly: Digital Dojo: 9 Infographics Worth Checking Out via @mjtiscione @NinjasMarketing http://t.co/mqAPj…
RT @mjtiscione: —–> RT @SanaKnightly: Digital Dojo: 9 Infographics Worth Checking Out via @mjtiscione @NinjasMarketing http://t.co/mqAPj…
—-> RT @EricaSimpson79: Digital Dojo: 9 Infographics Worth Checking Out via @mjtiscione @NinjasMarketing http://t.co/mqAPjOwmnn
http://t.co/pYVOcGzOeQ – Digital Dojo: 9 Infographics Worth Checking Out
Digital Dojo: 9 Infographics Worth Checking Out via @mjtiscione @NinjasMarketing http://t.co/vmLqnuKYk9 RT @mjtiscione
RT @sexysocial: Digital Dojo: 9 Infographics Worth Checking Out via @mjtiscione @NinjasMarketing http://t.co/mqAPjOwmnn
RT @IMNinjaMike: Digital Dojo: 9 Infographics Worth Checking Out | http://t.co/iTbuvqvsXA via @mjtiscione @NinjasMarketing
@IMNinjaMike @seonow @NinjasMarketing Thanks for sharing. 🙂
Digital Dojo: 9 Infographics Worth Checking Out | http://t.co/WCxQItHTBb @mjtiscione @NinjasMarketing
Jim Moritz liked this on Facebook.
Really cool Infographics, Mike! Liam Neesen kills is hilarious.
I wanted to share one that we made on the topic of SEO:
http://blog.linkbird.com/en/infographics/state-of-seo-agencies/
Rui Miguel liked this on Facebook.
Comments are closed.